


1 - INTRODUCTION
2 - NEEDS AND INSTALLATION
3 - USING JQuickPlot
3.1 - Main Configuration
3.2 - Graph Configuration
3.3 - Plots and Renderers
4 - CREDITS AND LICENCE
5 - BUGS
1 - INTRODUCTION
Suppose you have a file with several colums and you want to plot curves between two colums; suppose also you want to compare some different curves like this and with some different files also ... Thus you may use gnuplot or Jplot. But perhaps it is too much complicated to learn or to put into place. Thus if it is the case, you may use JQuickPlot (Java Quick XY Plot) ;-) otherwise you may also take this tool as an example for drawing curves using the java library Jfreechart. In this last case have a look to the source code commented with javadoc.
Indeed, I have developed this tool, quite quickly in JAVA, using the following libraries :
2 - NEEDS AND INSTALLATION
Because it has been written in JAVA, it is not dedicated to a particular OS ... then if you use windows or Linux it does not matter ...
First of all, yes you need the Tool with associated libraries ;-)
Then you also need a Java Environment. Get it from Sun JDK.
Then that should be enough. Be sure you have the java command into you path and type from the JQuickPlot directory on Windows :
| java.exe -classpath .\src\lib\JQuickPlot.jar;.\src\lib\jfreechart-1.0.9.jar;.\src\lib\jcommon-1.0.12.jar; .\src\lib\swing-layout-1.0.3.jar;.\src\JQuickPlot.jar;.\src JQuickPlot.JQuickPlot 3 "Test" |
If you have a Linux system it is quite the same :
| java -classpath .\src\lib\JQuickPlot.jar:.\src\lib\jfreechart-1.0.9.jar:.\src\lib\jcommon-1.0.12.jar: .\src\lib\swing-layout-1.0.3.jar:.\src\JQuickPlot.jar:.\src JQuickPlot.JQuickPlot 3 "Test" |
3 represents the number of graphs you want to have and test is the main title for the curves.
On Windows you also may simply use the link run.bat and on Linux the script run.sh (by doing sh ./run.sh).
3 - USING JQuickPlot
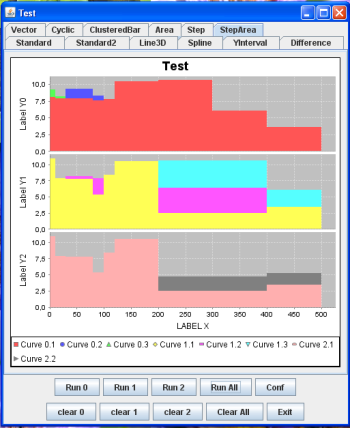
Here is an example of the tool windows :
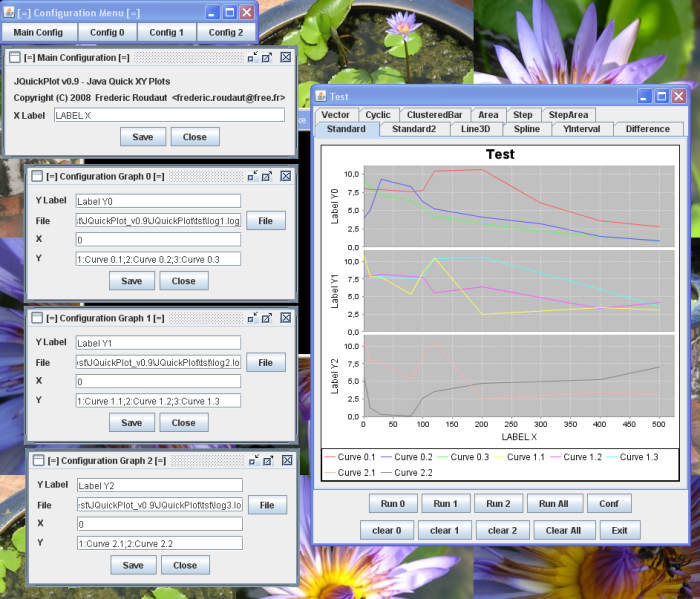
As you can see, you have a main window containing the curves and some configuration windows. Each curves window contains several graphs. Each graph may represent several XY plots. For each graph you need to have a plot file with some differents columns. For each plot dedicated to a graph, a column will be used for the range (Y), another one, identical to each plot in the graph, will represent the domain (X).
.3.1 - Main Configuration
Using the configuration button you may get the Main Configuration Menu. This Menu will let you fix the domain name used by every graph, every plot on all curves windows.
3.2 - Graph Configuration
Using the configuration button you also may get the Configuration Menu for all Graphs. For each graph a dedicated Configuration Menu is used. This menu will let you to fix :
- the range name used by the graph
- the File used by the graph
- the column used by each plot for the domain
- the differents columns used by the different plots for the range
- the legend used by the different curves
The different value used in the column are integer or float (in this last case the . symbol is used and not the , symbol).
Thus to describe a column for the range associated to each plot in a graph, you juste have to fill the X target with the column value (integer beginning at 0) as in the previous example.
To describe columns for the domain associated to the different plots in a graph you juste have to fill the Y target using the following format :
| (ColumnValue:Title;)+ |
Each ColumnValue begins to 0. The Title is optional, and the ; also if your graph only contains one plot. The Title will be used to name your plot (if the title is identical to several plots, it will be merged ;-)). In the previous picture, for example this field was :
| 1:curve 0.1;2: curve 0.2;3:curve 0.3 |
Have a look on the picture to check it contains 3 plots. The first one (curve 0.1) uses the column n°1 for the domain, the second one (curve 0.2) uses the column n°2 and the third one (curve 0.3) uses the column n°3 for the domain. For all plots the range uses column n°0.
3.3 - Plots and Renderers
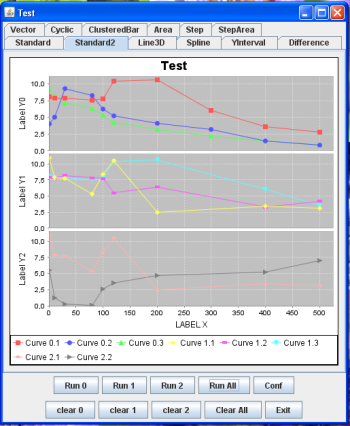
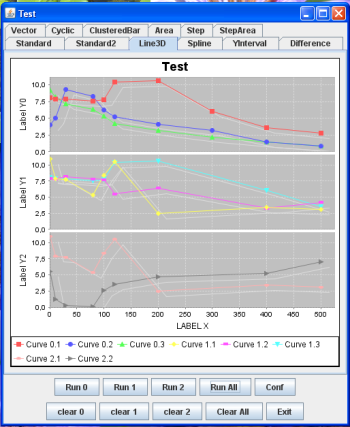
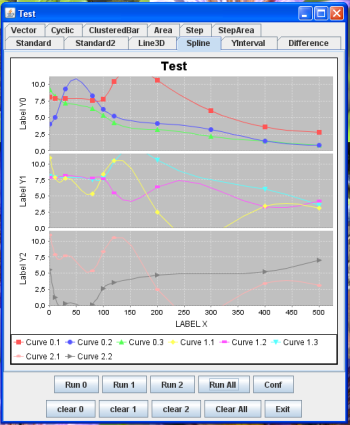
You will constate that the main windows contains several tabs. Each tab use a different renderer for the plot drawing.
Thus, it has been developed using the following renderers :
- StandardXYItemRenderer : Standard renderer for the XYPlot class.
- DefaultXYItemRenderer : Standard renderer for the XYPlot class with dots.
- XYLine3DRenderer : A XYLineAndShapeRenderer that adds a shadow line to the graph to emulate a 3D-effect.
- XYSplineRenderer : A Spline Renderer.
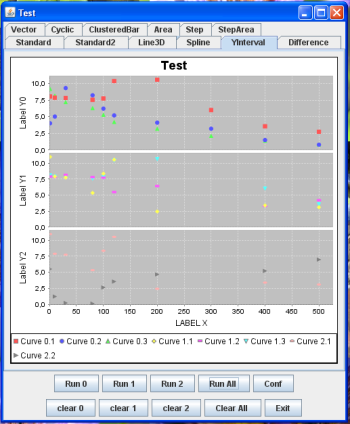
- YIntervalRenderer : A renderer that draws a line connecting the start and end Y values for an XYPlot .
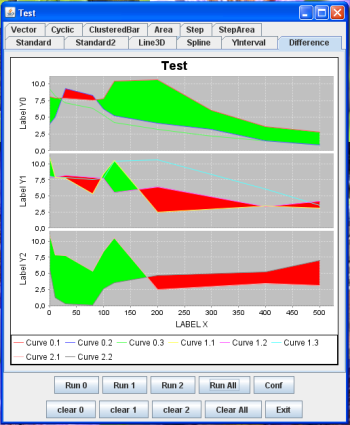
- XYDifferenceRenderer : A renderer for an XYPlot that highlights the differences between two series.
The renderer expects a dataset that:
- has exactly two series;
- each series has the same x-values;
- no null values;
- VectorRenderer : A renderer that represents data from an VectorXYDataset by drawing a line with an arrow at each (x, y) point.
- CyclicXYItemRenderer : The Cyclic XY item renderer is specially designed to handle cyclic axis. While the standard renderer would draw a line across the plot when a cycling occurs, the cyclic renderer splits the line at each cycle end instead. This is done by interpolating new points at cycle boundary. Thus, correct appearance is restored. The Cyclic XY item renderer works exactly like a standard XY item renderer with non-cyclic axis.
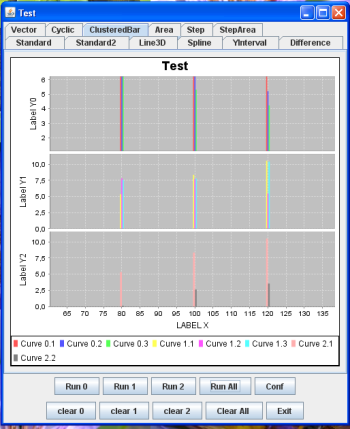
- ClusteredXYBarRenderer : An extension of XYBarRenderer that displays bars for different series values at the same x next to each other. The assumption here is that for each x (time or else) there is a y value for each series. If this is not the case, there will be spaces between bars for a given x. This renderer does not include code to calculate the crosshair point for the plot.
- XYAreaRenderer : Area item renderer for an XYPlot.
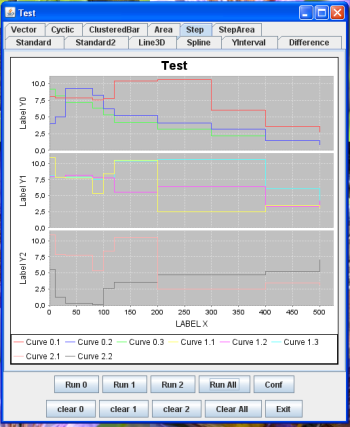
- XYStepRenderer : Line/Step item renderer for an XYPlot . This class draws lines between data points, only allowing horizontal or vertical lines (steps).
- XYStepAreaRenderer : A step chart renderer that fills the area between the step and the x-axis.

4 - CREDITS AND LICENCE
This tool is free software; you can redistribute it and/or modify it under the terms of the GNU General Public License as published by the Free Software Foundation; either version 2 of the License, or (at your option) any later version.
This program is distributed in the hope that it will be useful, but WITHOUT ANY WARRANTY; without even the implied warranty of MERCHANTABILITY or FITNESS FOR A PARTICULAR PURPOSE. See the GNU General Public License for more details.
5 - BUGS
If you find any bug you may send me reports at:
frederic.roudaut@free.fr